
Effective liquid cooling system monitoring in 2026 requires integrating high precision sensors with intelligent edge computing to prevent catastrophic failures like pump cavitation, coolant leakage, and condensation-induced short circuits. Modern data centers must deploy continuous tracking of flow rates, differential pressure, temperature, and water quality to maintain optimal Power Usage Effectiveness (PUE) and equipment longevity. Advanced IoT platforms now utilize AI driven analytics to predict water hammer events and analyze system stability in real time. By combining industrial-grade sensors, such as liquid turbine flow meters and monocrystalline differential pressure transmitters, with smart edge gateways, facility managers can transition from reactive maintenance to predictive asset management. This comprehensive approach ensures thermal reliability, prevents corrosion, and maximizes energy efficiency in high-density computing environments.
Executive Summary: The Imperative of Intelligent Thermal Management in 2026
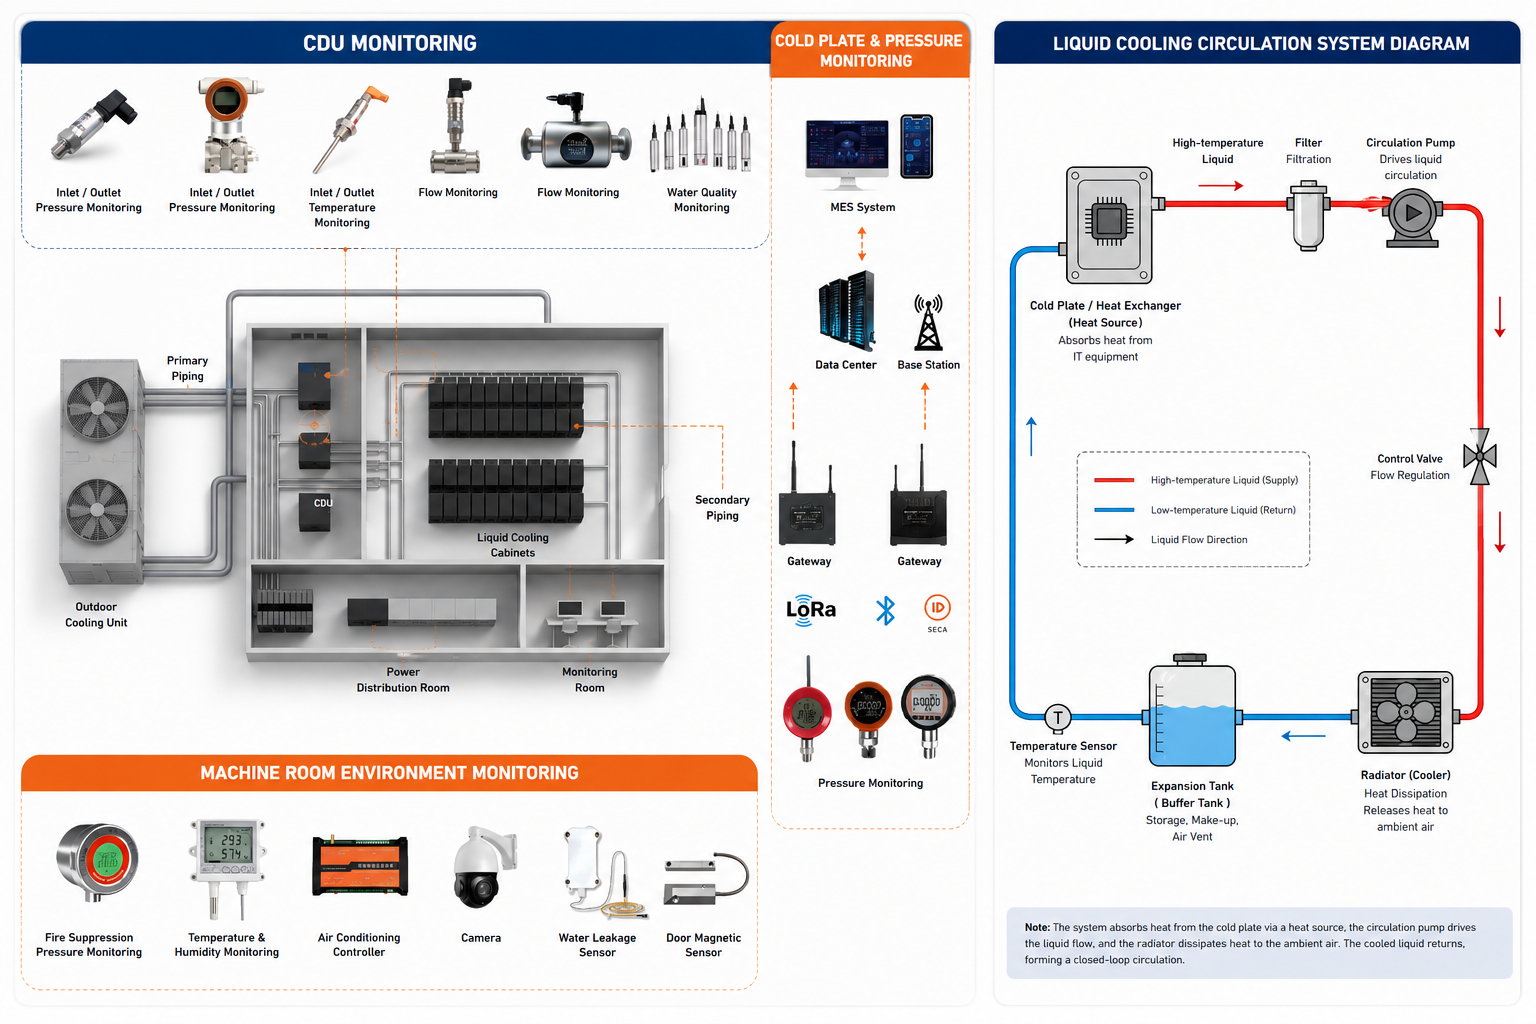
Liquid cooling system monitoring has evolved from a supplementary operational task into a critical infrastructure requirement for modern data centers, driven by the exponential increase in rack density and chip TDP (Thermal Design Power). According to recent industry benchmarks, cooling infrastructure accounts for nearly 40% of total data center energy consumption, making precise thermal management vital for achieving sustainability targets. Facility operators face severe operational pain points, including pump cavitation, pipeline leakage, inadequate makeup fluid leading to pump dry-running, and supply liquid temperatures approaching the dew point, which risks condensation and short circuits. Furthermore, uneven heat dissipation accelerates (energy efficiency degradation), while corrosion silently degrades and (pipelines and cold plates), drastically shortening system lifespan. To mitigate these risks, deploying a comprehensive monitoring architecture utilizing advanced IoT data acquisition terminals, high-precision digital pressure gauges, and intelligent edge gateways is no longer optional. This guide outlines the technical specifications, deployment strategies, and analytical frameworks necessary to secure high-availability liquid cooling environments in 2026.
Core Pain Points and Failure Mechanisms in Liquid Cooling
Understanding the root causes of thermal system failures is the foundational step in designing an effective monitoring strategy. Pump cavitation and (pipeline leakage) remain the most frequent causes of unplanned downtime, often resulting from inadequate pressure differentials or mechanical fatigue. When (makeup fluid is not supplied in time), pumps experience dry-running, leading to immediate mechanical seal failure and motor burnout.
Thermal boundary violations present another critical risk. When (supply liquid temperature approaches the dew point), condensation forms on external surfaces and internal components, causing catastrophic (short circuits). Simultaneously, (uneven heat dissipation) creates localized hot spots that force cooling systems to overcompensate, driving up energy costs. Finally, chemical degradation through (corrosion of pipelines and cold plates) occurs when water quality parameters drift outside acceptable tolerances, introducing particulate matter that clogs micro-channels and reduces heat transfer coefficients. Addressing these specific failure modes requires targeted sensor placement and continuous data validation.
Essential Sensor Technologies for Liquid Cooling Monitoring
Selecting the appropriate instrumentation is paramount for accurate system visibility. Flow measurement forms the baseline of thermal capacity calculation. The MD-S455 Liquid Turbine Flow Meter features a 304 stainless steel body and a 2Cr13 impeller with clamp connections, offering robust performance for clean coolant applications. For applications requiring higher accuracy and immunity to fluid conductivity variations, the MD-S451 Compact Electromagnetic Flow Meter utilizes an ARM Cortex-M4 32-bit processor and a 24-bit ADC, with one-time molding electrodes and linings to eliminate leakage paths and ensure long-term stability.
Pressure monitoring must capture both absolute system pressure and dynamic differentials. The MD-S123 Monocrystalline Silicon Differential Pressure Transmitter employs a German MEMS chip and a 3051-compatible structure, outputting 4-20mA+HART signals for precise filter clogging detection and pump health assessment. For localized, high-visibility pressure tracking, the MD-S542 Digital Remote Pressure Gauge complies with GB25972-2024 standards, features IP67 protection, and provides RS485 communication with configurable upper and lower limit alarms. Technicians performing maintenance can utilize the MD-S278 Wireless Digital Pressure Gauge, which offers a 2.3-inch LCD, 330° rotatable dial, Bluetooth connectivity, and a 6-month battery life for rapid, cable-free diagnostics.
Environmental and leak detection sensors protect the facility perimeter. The MDS351 Digital Temperature & Humidity Sensor features a 68x50mm LCD with °C/°F switching and wall-mount capability, essential for dew point calculations. In the event of a breach, the MD-A276W Wireless Water Immersion Sensor provides IP68 rated, ultra-low-power lithium battery operation to instantly trigger alarms. Water quality integrity is maintained using the MD-K953 Water Quality Sensor Probe, which continuously tracks pH, conductivity, and turbidity to prevent internal corrosion.
Edge Computing and Intelligent Data Acquisition
Raw sensor data must be aggregated, processed, and contextualized to provide actionable intelligence. The MD-S906 Edge Gateway serves as the central nervous system for CDU (Coolant Distribution Unit) monitoring, supporting 4G and RS485 communication, 4-channel AC220 analog inputs, 4-channel digital inputs, and 4 channel relay outputs in a DIN rail mount form factor. This localized processing capability allows for immediate hardware intervention, such as shutting down a cavitating pump before mechanical failure occurs.
For larger-scale (data center environmental monitoring), the MD-S907 IoT Data Acquisition Terminal provides industrial-grade wireless networking, 8DI+8AI channels, and dual Ethernet NICs for network redundancy. These gateways feed data into intelligent platforms like the SECA APP, which utilizes Bluetooth, LoRa, and (NearLink) connections. The platform’s (intelligent analysis engine) performs (pressure retention and leak analysis), (water hammer analysis), (system stability analysis), and (energy consumption analysis). This multi-dimensional trend analysis and (equipment health analysis) transform passive monitoring into proactive asset management.
Technical Comparison of Flow Measurement Technologies
Selecting the correct flow meter depends on fluid properties, pipe diameter, and required accuracy. The following table compares primary technologies for data center liquid cooling:
| Feature | Liquid Turbine Flow Meter (MD-S455) | Compact Electromagnetic Flow Meter (MD-S451) |
|---|---|---|
| Operating Principle | Mechanical impeller rotation | Faraday’s Law of Electromagnetic Induction |
| Fluid Compatibility | Clean, non-corrosive coolants | Conductive liquids, glycol mixtures, slurries |
| Moving Parts | Yes (2Cr13 impeller) | None (solid-state measurement) |
| Pressure Drop | Moderate (flow-dependent) | Negligible (unobstructed bore) |
| Maintenance Requirement | Periodic bearing/impeller inspection | Minimal (self-diagnostic electrode check) |
| Best Application | Primary CDU supply/return lines | Secondary loops, dirty/variable fluids |
Deployment Strategies for CDU and Cold Plate Monitoring
Effective monitoring requires strategic sensor placement aligned with system hydraulics. For (cold plate pressure retention monitoring), differential pressure transmitters must be installed across each cold plate or manifold branch to detect micro-channel blockages before thermal throttling occurs. The MD-S103 Compact Pressure Transmitter, featuring a piezoresistive sensor, 316L stainless steel construction, and anti-vibration design, is ideal for these high-frequency measurement points.
CDU monitoring requires comprehensive parameter tracking. Supply and return temperatures, pressures, and flow rates must be measured simultaneously to calculate real-time heat removal capacity. The MD-S311 Compact Temperature Transmitter with its 316L stainless steel probe and IP65 waterproof rating provides reliable immersion temperature data. The MD-S211 High Precision Digital Pressure Gauge serves as a primary reference standard for calibrating transmitter outputs during commissioning and annual maintenance.
Industry Standards and Compliance Requirements
Data center liquid cooling systems must adhere to stringent industry standards to ensure safety and interoperability. ASHRAE Technical Committee 9.9 provides comprehensive guidelines for liquid cooling, including recommended water quality parameters, material compatibility matrices, and thermal envelope specifications. Compliance with these standards prevents galvanic corrosion and biological growth.
In China, the updated GB25972-2024 standard for digital pressure gauges mandates specific accuracy classes, environmental testing protocols, and communication interface requirements. Sensors like the MD-S542 are designed to meet this standard, ensuring reliable performance in industrial environments. The Uptime Institute’s Tier Standards also increasingly incorporate liquid cooling reliability metrics into overall facility grading, emphasizing the need for redundant monitoring paths and automated failover capabilities. Adherence to these frameworks not only ensures operational safety but also facilitates audit compliance and insurance qualification.
Mobile Diagnostics and Field Maintenance Workflows
Modern maintenance workflows leverage wireless connectivity to reduce mean time to repair (MTTR). The SECA APP integrates with Bluetooth-enabled instruments like the MD-S278 and MD-S261 Smart Digital Pressure Gauge, which features a 2-inch full LCD screen and 1 million data records. Technicians can pull historical pressure trends directly from the gauge during troubleshooting, eliminating the need to access central SCADA systems for basic diagnostics.
The app’s (digital twin interaction) capabilities allow field personnel to visualize system topology, overlay real-time sensor data, and receive AI-generated maintenance recommendations. This integration of mobile diagnostics with centralized monitoring creates a closed-loop maintenance process, where field observations validate predictive models and central analytics guide field interventions.
Frequently Asked Questions (FAQ)
Post time: Aug-04-2026